

- Indicators
- Liquidity Heatmap
Liquidity Heatmap
- v1.22_1
August 29, 2026
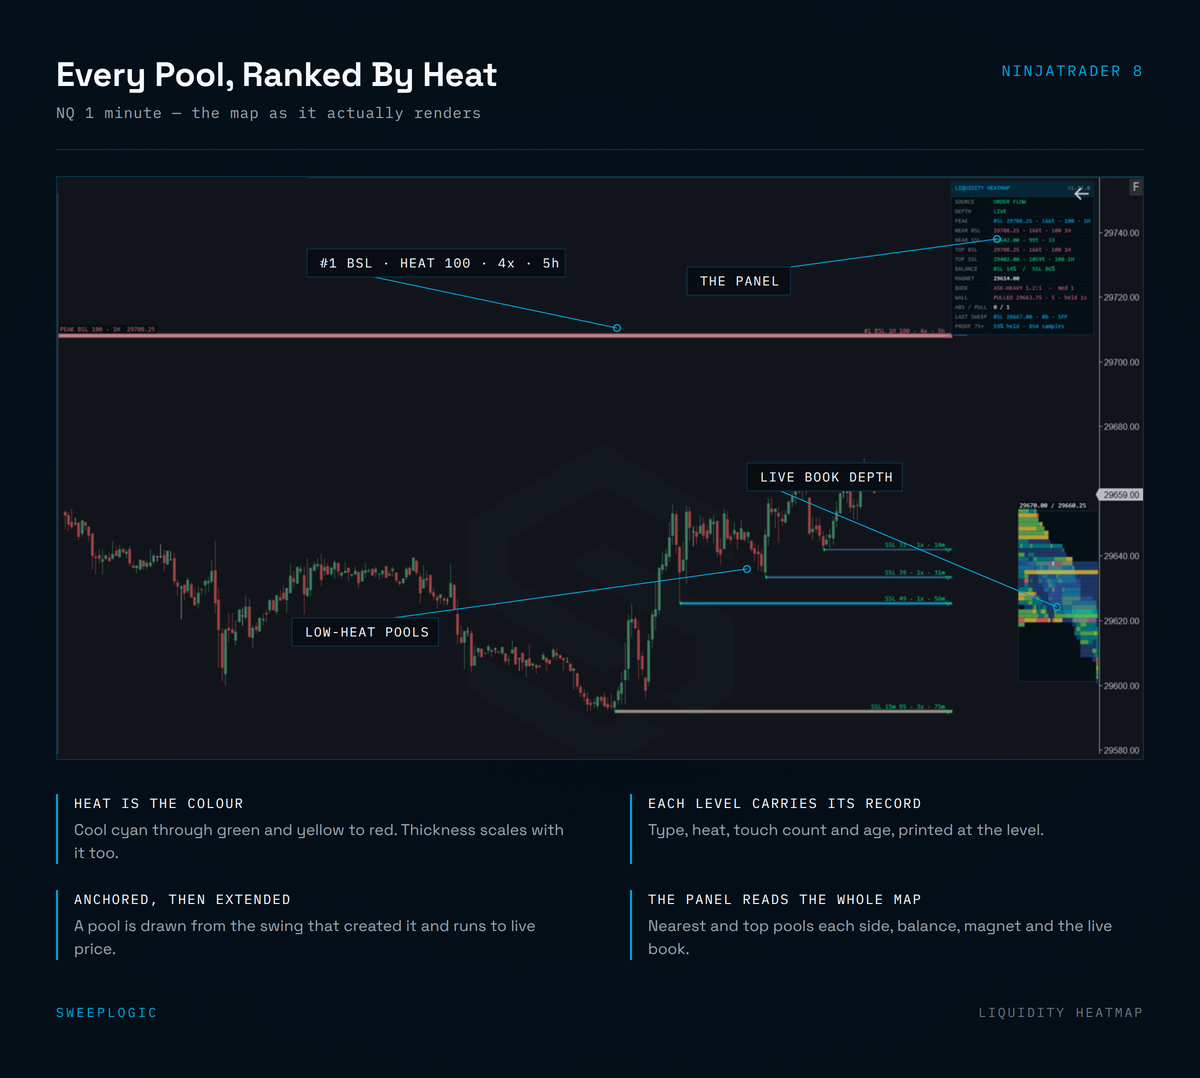
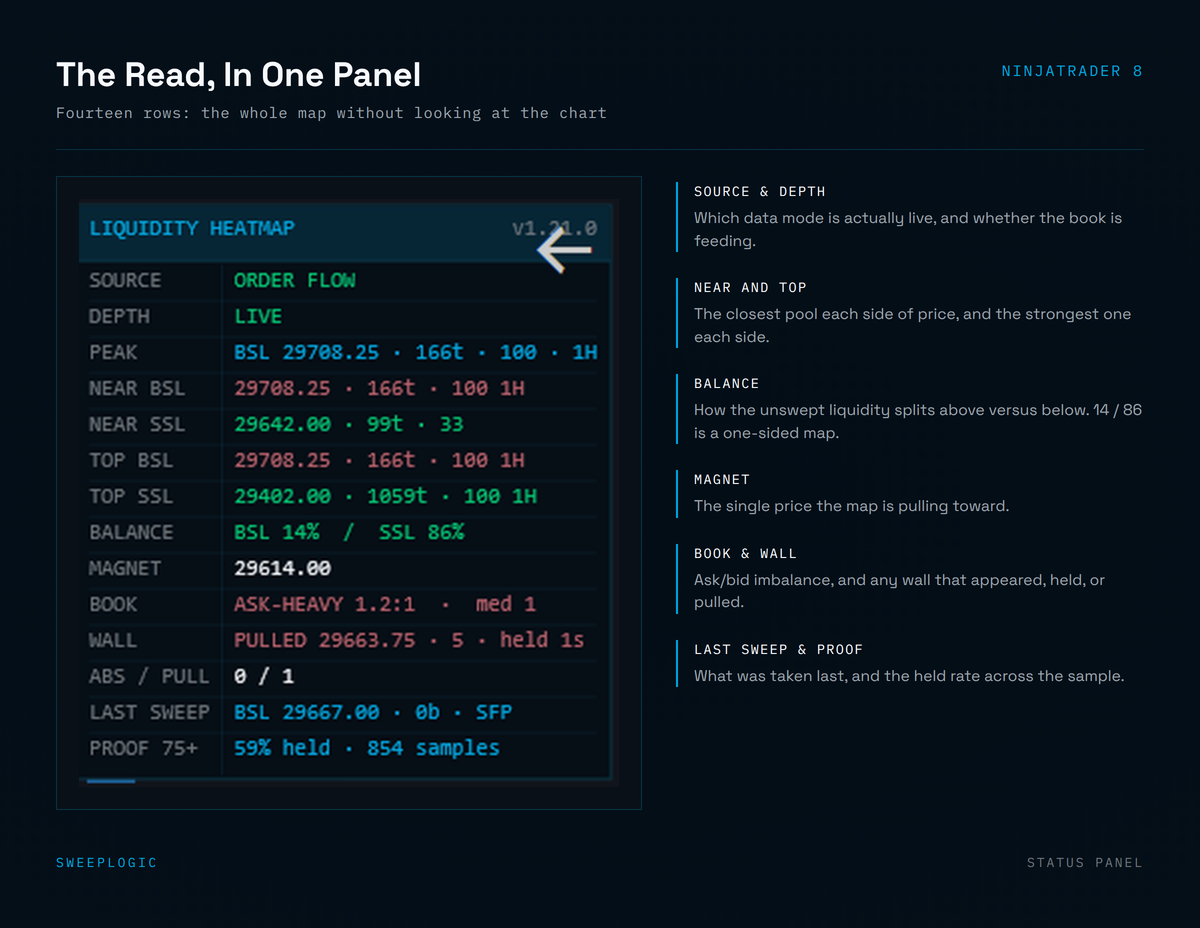
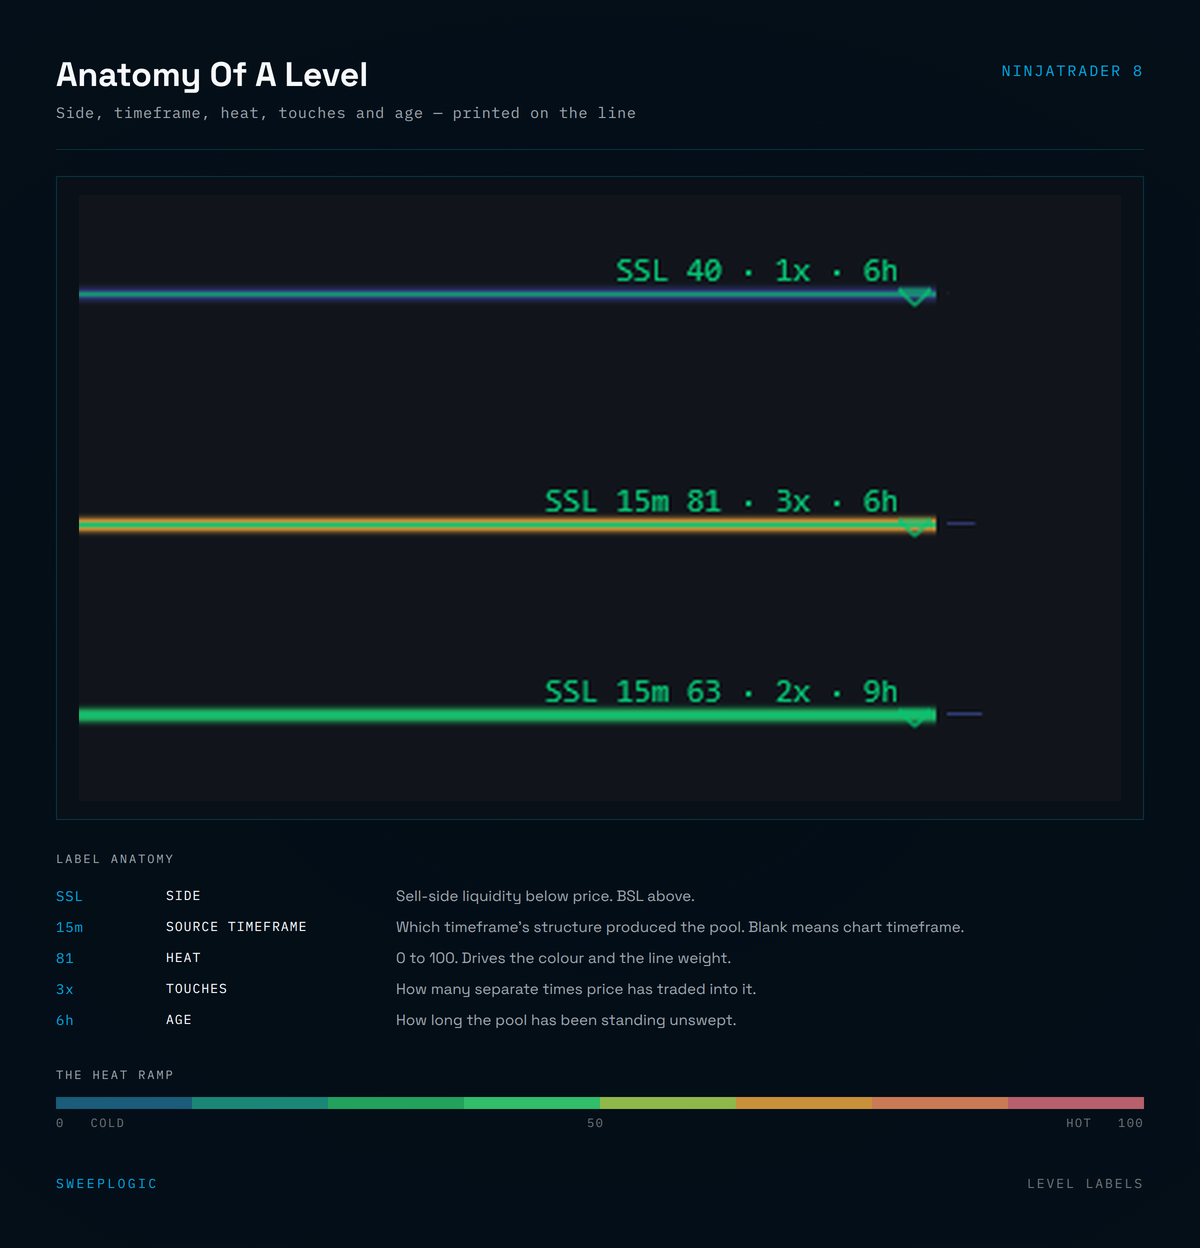
Every pool, scored. Swing highs and lows, equal highs and lows, prior-day extremes and session extremes — mapped on both sides of price and scored 0 to 100. The score weighs the volume that built the pool, how many times price has returned to it, and how recently it formed. It’s an absolute scale, not a ranking of what happens to be on your chart, so 88 means the same thing on a quiet Tuesday as it does on a CPI print. The score is auditable. Switch the labels to Components and every pool shows its three inputs. You can see whether an 88 came from heavy volume or from being fresh. The weights themselves are settings, not secrets — adjust them, and log every outcome to CSV if you want to set them from your own data. The raid, and the failed raid. A swept pool leaves a footprint from where it formed to the bar that took it. If price closes back through, it’s marked as a reclaim — the sweep that failed. A profile that agrees with the map. A right-edge volume histogram with point of control, each shelf labelled as a share of the peak. Where volume traded and where stops rest are different questions — the indicator draws both, and their disagreement is worth reading.
$149.00
Lifetime License · Instant Download
Watch Video About the Indicator
Trading Concepts You'll Use
Buy-Side & Sell-Side Liquidity
Liquidity Pools & Stop Clusters
Equal Highs & Equal Lows
Liquidity Sweeps & Stop Runs
Sweep and Reclaim (SFP)
Draw on Liquidity
Prior Day High & Low
Session Highs & Lows
Higher-Timeframe Liquidity
Order Book Absorption
Volume Profile & Point of Control
Killzone Session Structure
Features
Buy-side and sell-side liquidity pools mapped on both sides of price
Every pool scored 0–100 on a calibrated, absolute scale
Score breakdown on the label — volume, touches and freshness shown separately
Adjustable score weights, exposed as settings rather than hidden
Higher-timeframe pools from 15m, 1H and 4H drawn on your execution chart
Equal highs and equal lows detected and weighted
Prior-day and session extremes seeded automatically
Sweep footprints showing where a pool formed and the bar that took it
Sweep-and-reclaim (SFP) marked when price closes back through
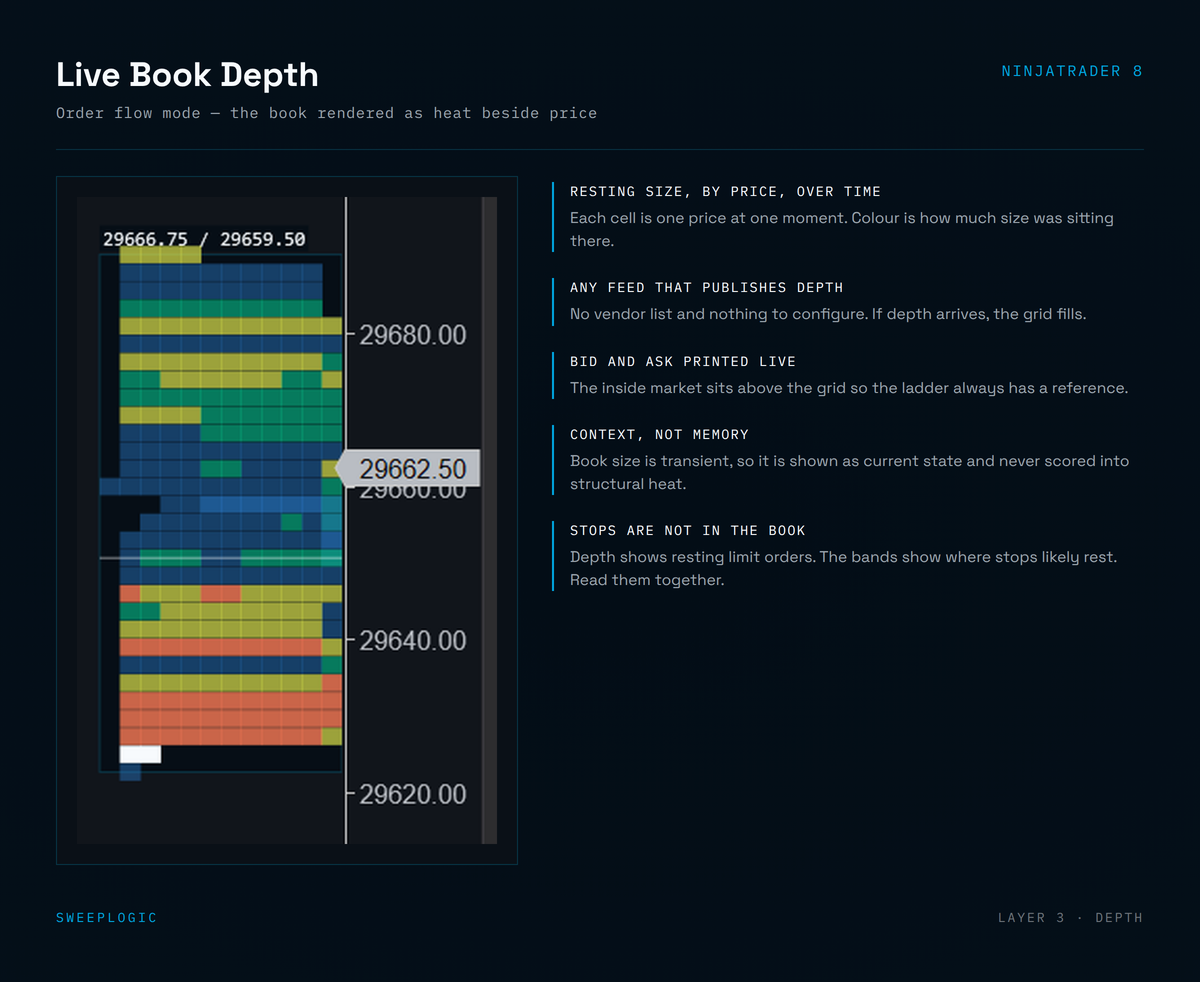
Live order-book depth ribbon with resting size over time
Walls classified as absorbed or pulled
Volume profile with point of control and share-of-peak labels
Peak liquidity marker for the strongest pool on the chart
Click any level for a full detail card
Sweep outcome history tracked per heat band and saved between sessions
Alerts on approach, sweep, reclaim, equal H/L and depth walls
Publishes into SweepLogic Command Center automatically
- Built For
ICT and Smart Money Concepts methodology
Intraday execution on 1–15 minute charts
Traders who work sweeps, stop runs and failed raids
Anyone who wants higher-timeframe liquidity visible while executing fast
Order-flow traders with a Level 2 depth feed
Traders who want a scoring model they can inspect and adjust
- Not For
Traders looking for buy and sell signals — this maps structure, it doesn't call trades
Automated strategies — it's a visual indicator and places no orders
Traders who want a fixed win rate or performance figure attached
Anyone expecting real resting orders on historical bars — pools are inferences, and the depth ribbon is the only true order data
Position or swing traders working from daily charts alone
What You Get
- Liquidity Heatmap (.zip)
$149
- Pre-configured templates & workspaces
$49
- Setup guide & instructions
$99
- Lifetime updates
$99
- Discord support
$99
- Total Value
$495
- Your Price Today
$149.00
7-Day Money-Back Guarantee
Install it. Run it on your charts. Test it on live or sim. If it doesn't sharpen your edge in 7days, email us for a full refund — no friction, no forms, no
questions. The risk is on us.
Common Questions
Do I need a Level 2 data feed?
No. The liquidity map, scoring, higher-timeframe pools, profile and sweep tracking all run on standard market data. A depth feed adds the order-book ribbon and wall classification. If no depth arrives, the panel says so and nothing else changes.
What does the heat score actually measure?
Three things, weighted: the volume percentile of the swing that formed the pool, how many times price has returned to it, and how recently it formed — times a multiplier for equal highs/lows and higher timeframes. It’s an absolute 0–100 scale, so the same number means the same thing across sessions and instruments. Set the labels to Components and you can see all three inputs on the chart.
Can I change how the score is calculated?
Yes. The three weights, the touch saturation point, the multipliers and the reference window are all settings. There’s also a CSV log that records every sweep outcome alongside its score inputs, so the weights can be set from your own data rather than taken on trust.
Does this tell me where price is going?
No. It maps where stop liquidity is likely resting and scores how significant each pool is. Price being drawn toward liquidity is a structural observation, not a forecast, and the indicator makes no claim about outcomes.
Are the liquidity pools real orders?
No, and the product is explicit about this. Resting stop orders aren’t visible on any chart, so every pool is inferred from where traders plausibly positioned. The one exception is the depth ribbon, which shows the actual visible order book.
What's the difference between absorbed and pulled?
When a large resting order disappears, either price traded into it and consumed it (absorbed — real size met real aggression) or it was cancelled without being traded against (pulled). Those mean opposite things, and telling them apart needs live order-book access.
Will it work with my other SweepLogic indicators?
Yes. It publishes into Command Center automatically — pools appear in the levels ladder with their heat scores beside your Order Blocks, FVGs and Key Levels. It also runs perfectly well on its own.
What timeframe should I use it on?
Built for 1–15 minute execution charts. The higher-timeframe layer brings 15m, 1H and 4H pools onto whatever chart you’re trading, so you don’t need multiple charts open.
Will it slow my platform down?
There’s a Normal and HD render mode, and a built-in diagnostics readout showing per-frame timing so you can see the cost directly. Drawing is capped by a max-pools-per-side setting.
Ready to add this indicator to your stack?
Instant download. Lifetime license. 7-day money-back guarantee.