

- Indicators
- Daily Bias SMC
Daily Bias SMC
- v2.4.1
Updated August 13, 2026
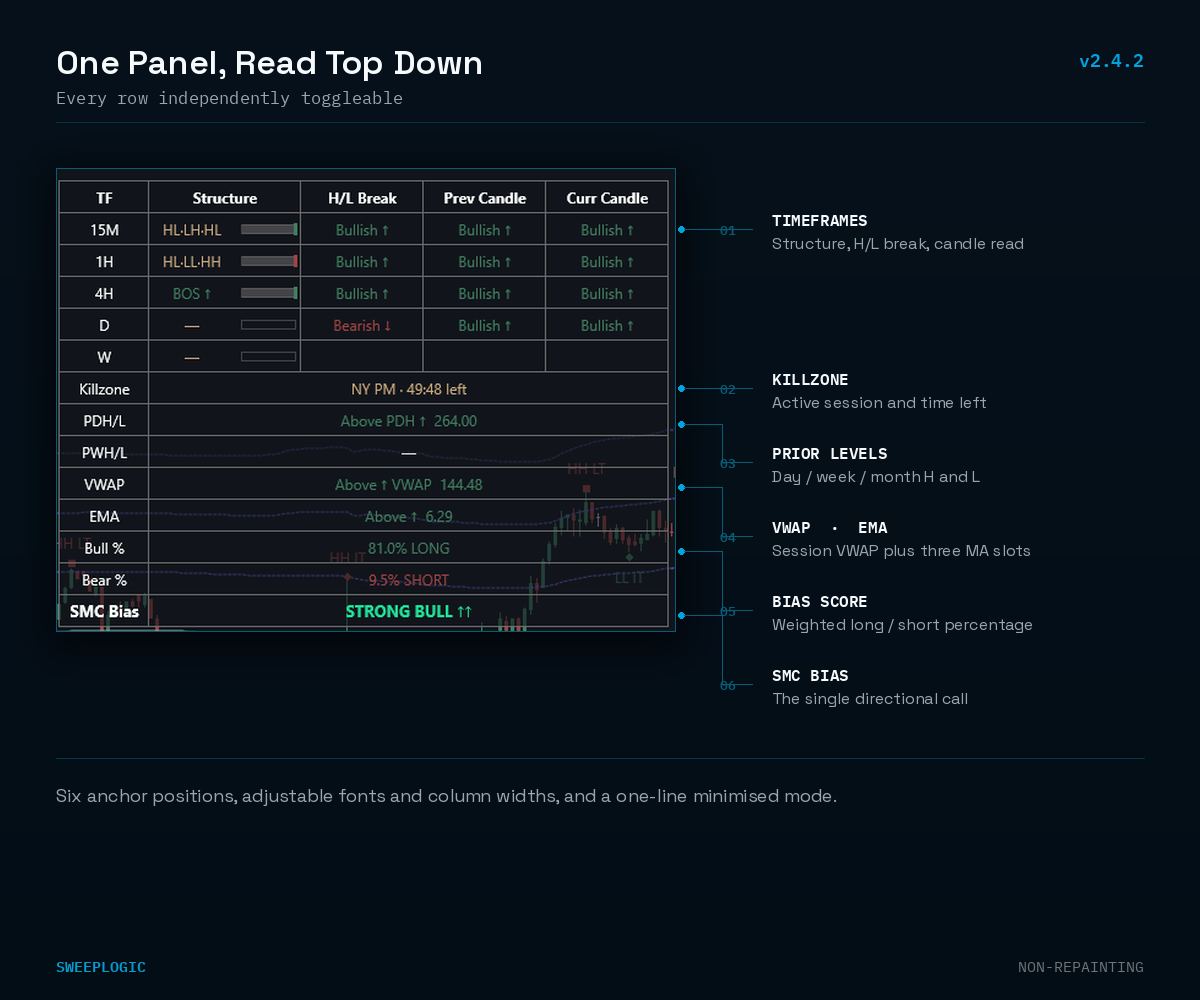
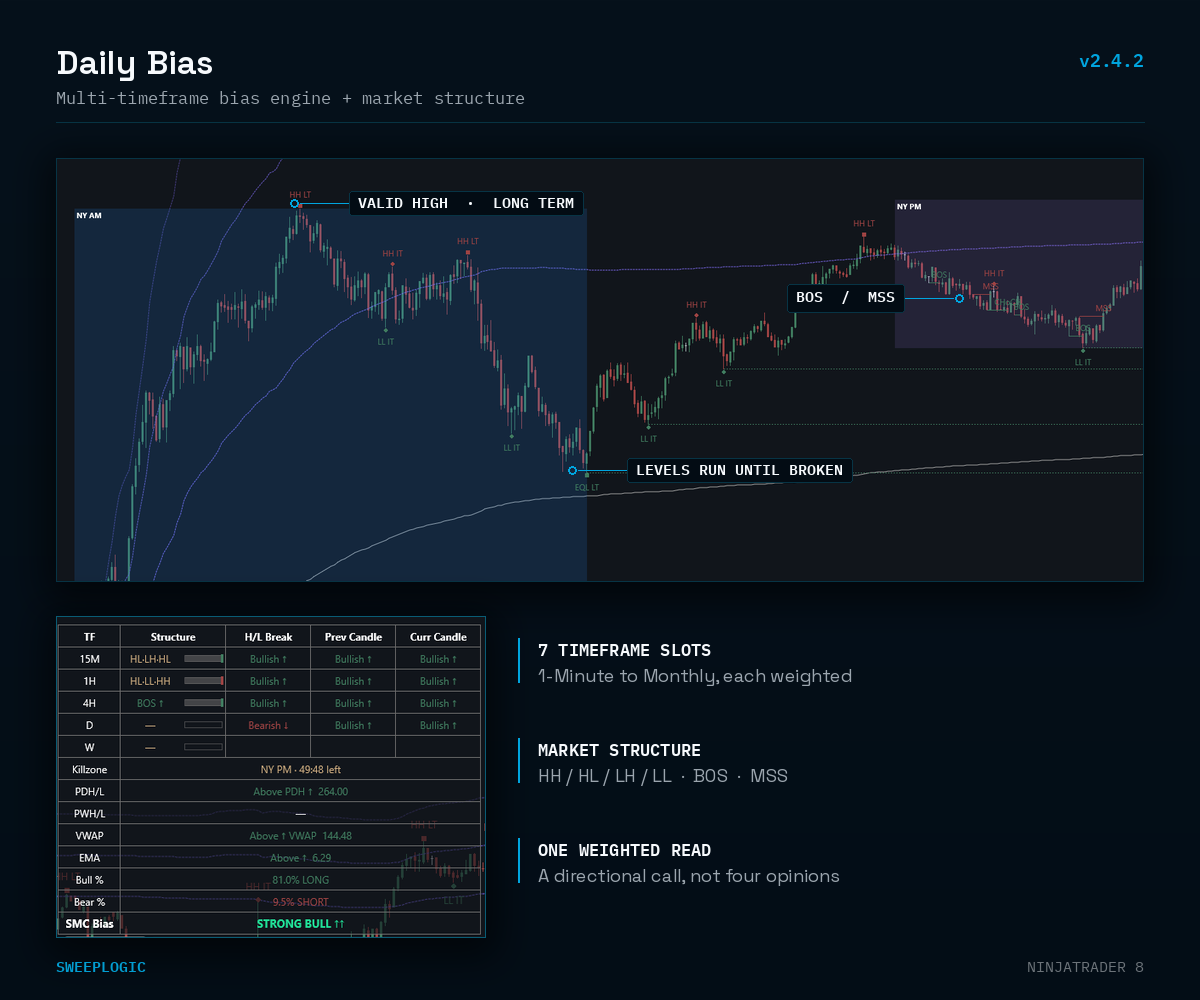
A multi-timeframe bias table plus a full market structure engine all-in-one. Seven configurable timeframes read structure, candle breaks, VWAP and prior Day/Week/Month levels into one weighted directional read — bullish, bearish or neutral — while the chart itself gets valid highs and lows, ranked by significance, with level lines that run until price takes them out. Non-repainting, confirmed on bar close.
$149.00
Lifetime License · Instant Download
Watch Video About the Indicator
Trading Concepts You'll Use
Higher-Timeframe Structure
Draw on Liquidity
VWAP
Premium / Discount
Prior Session Open / Close
Break of Structure (BOS)
Market Structure Shift (MSS)
Change of Character (CHoCH)
Valid Highs & Lows
ICT killzone shading with an active-session countdown
Prior Day / Week / Month Levels
Features
7 configurable timeframe slots — 1-Minute to Monthly
Market structure engine — HH / HL / LH / LL with BOS, MSS and CHoCH
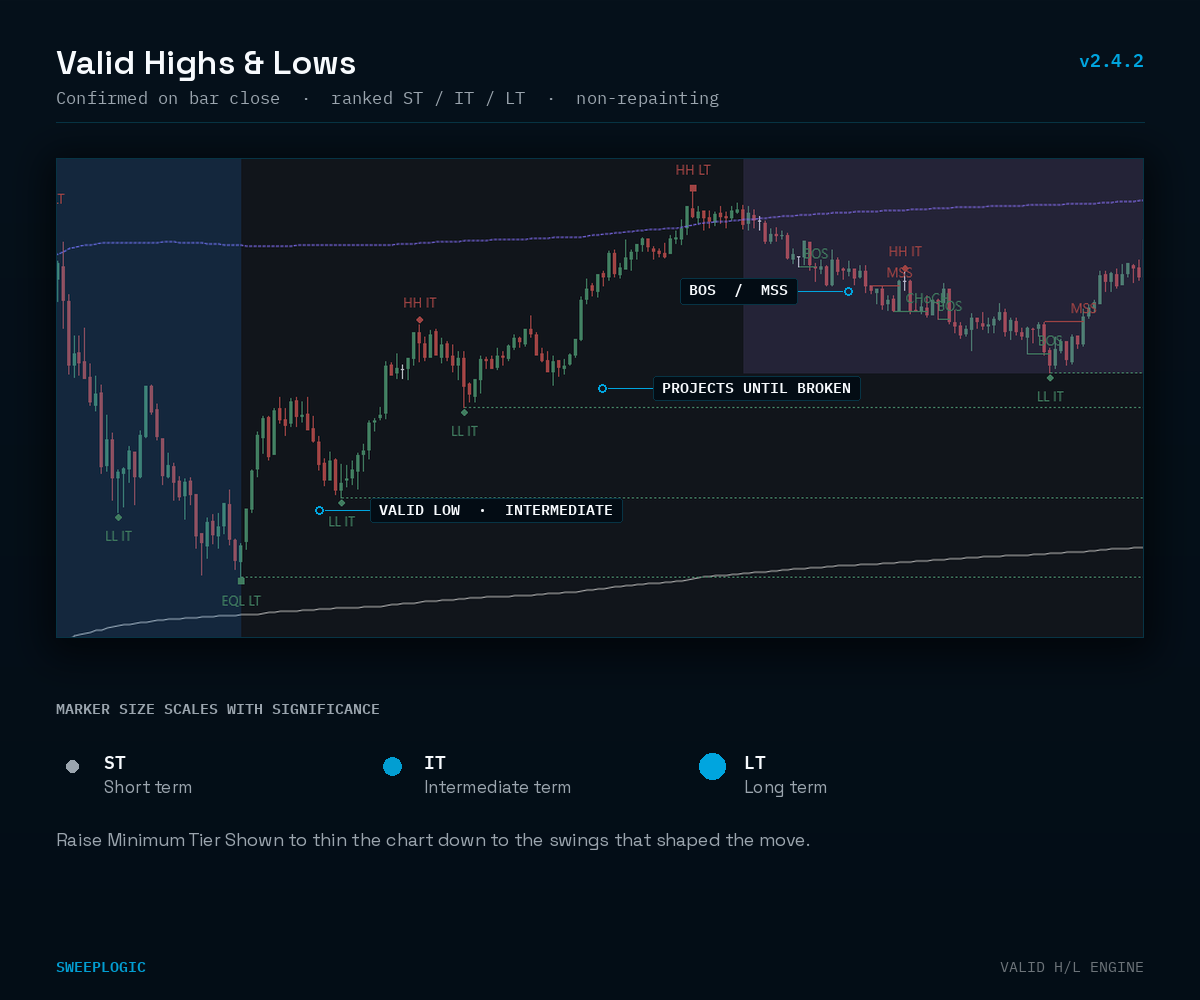
Valid high & low markers, ranked Short / Intermediate / Long Term
Level lines that project until price breaks them
Prior Day, Week & Month levels with live distance
Weighted bias score with confluence detection
Full alert suite — 9 event types, individually toggle
Session-reset VWAP with 3 standard deviation bands
Non-repainting — every read confirmed on bar close
One-click NinjaTrader® 8 import
- Built For
NT8 traders who want direction before they enter
ICT / SMC traders trading with the HTF draw
Traders who keep getting the setup right, direction wrong
Beginner traders who need a consistent bias filter
- Not For
Anyone wanting buy/sell arrows to blindly follow
Traders who enter without a directional read
Traders who fight the trend and call it a dip
Anyone expecting a holy-grail
What You Get
- Daily Bias SMC (.zip)
$99
- Pre-configured templates & workspaces
$49
- Setup guide & instructions
$49
- Lifetime updates
$49
- Discord support
$99
- Total Value
$345
- Your Price Today
$149.00
7-Day Money-Back Guarantee
Install it. Run it on your charts. Test it on live or sim. If it doesn't sharpen your edge in 7days, email us for a full refund — no friction, no forms, no
questions. The risk is on us.
Common Questions
What is the bias actually built from?
Higher timeframe structure, read the same way you’d read it manually. Each timeframe row is classified from its own completed candles — where the last close sits relative to the prior range, whether structure has shifted, and how the current session is developing against it. Nothing is inferred from a single indicator reading; the bias is the agreement or disagreement between the rows. As of v2.4, each timeframe’s swing structure also casts a weighted vote alongside its candle reads, so the score reflects where the market is in its structure and not only what the last candle did.
Why does it show multiple timeframes instead of one answer?
Because a one-word answer hides the thing you need most — whether the timeframes agree. A daily that’s bullish against a 4H that just shifted bearish is a different trading day than one where both point the same way. The panel shows each row’s own read, so you can see alignment and conflict rather than a number that has already averaged them together.
Does the bias change intraday, or is it fixed at the open?
Higher timeframe rows are set from completed candles and stay put until that candle closes. The developing session updates as it develops. That’s deliberate: your daily bias shouldn’t flip at 10:15 because of a fifteen-minute pullback, but you do want to see when the session is trading against the level that defined the bias in the first place.
How should I use the percentage reading?
Structure now contributes to that number, which means the percentages read differently than they did before v2.2 — the reading is doing more work than it used to.
Does it work with the rest of the suite?
The live bias publishes to the other tools, so Command Center can weight its playbook toward the side the higher timeframes favor and score counter-trend cases accordingly. Run it alone as a panel, or let it feed everything else.
What is a "valid" high or low?
Stricter than the three-candle swing most tools use. A candidate high only becomes valid once a later candle closes below that candle’s low — meaning the market genuinely rejected it, not just poked through. In a strong move nothing gets marked until the leg actually fails, which is the point: fewer marks, and every one of them means something.
My chart is covered in markers. What do I change?
Raise “Minimum Tier Shown” in the Valid Highs & Lows group. Every swing is ranked Short, Intermediate or Long Term using ICT’s own hierarchy — a swing flanked by two shallower ones on the same side gets promoted. Set it to Intermediate and you keep only the swings that shaped the move. That one dropdown thins markers and level lines together.
Is seven timeframes heavy?
Each enabled slot loads its own data and runs a full structure pass, so seven is genuinely more work than three. Most traders enable the timeframes they actually trade from. If you want it lighter, disable a slot or two or trim your loaded chart history.
Ready to add this indicator to your stack?
Instant download. Lifetime license. 7-day money-back guarantee.