

Draw on Liquidity
No indicator is right for everyone — it depends on what you trade and what you already know how to read. But the ones worth keeping share a short list of properties, and the ones you uninstall tend to fail in the same four places. Here’s the checklist, category by category.

By SWEEPLOGIC
- August 5, 2026
- 6 Min Read
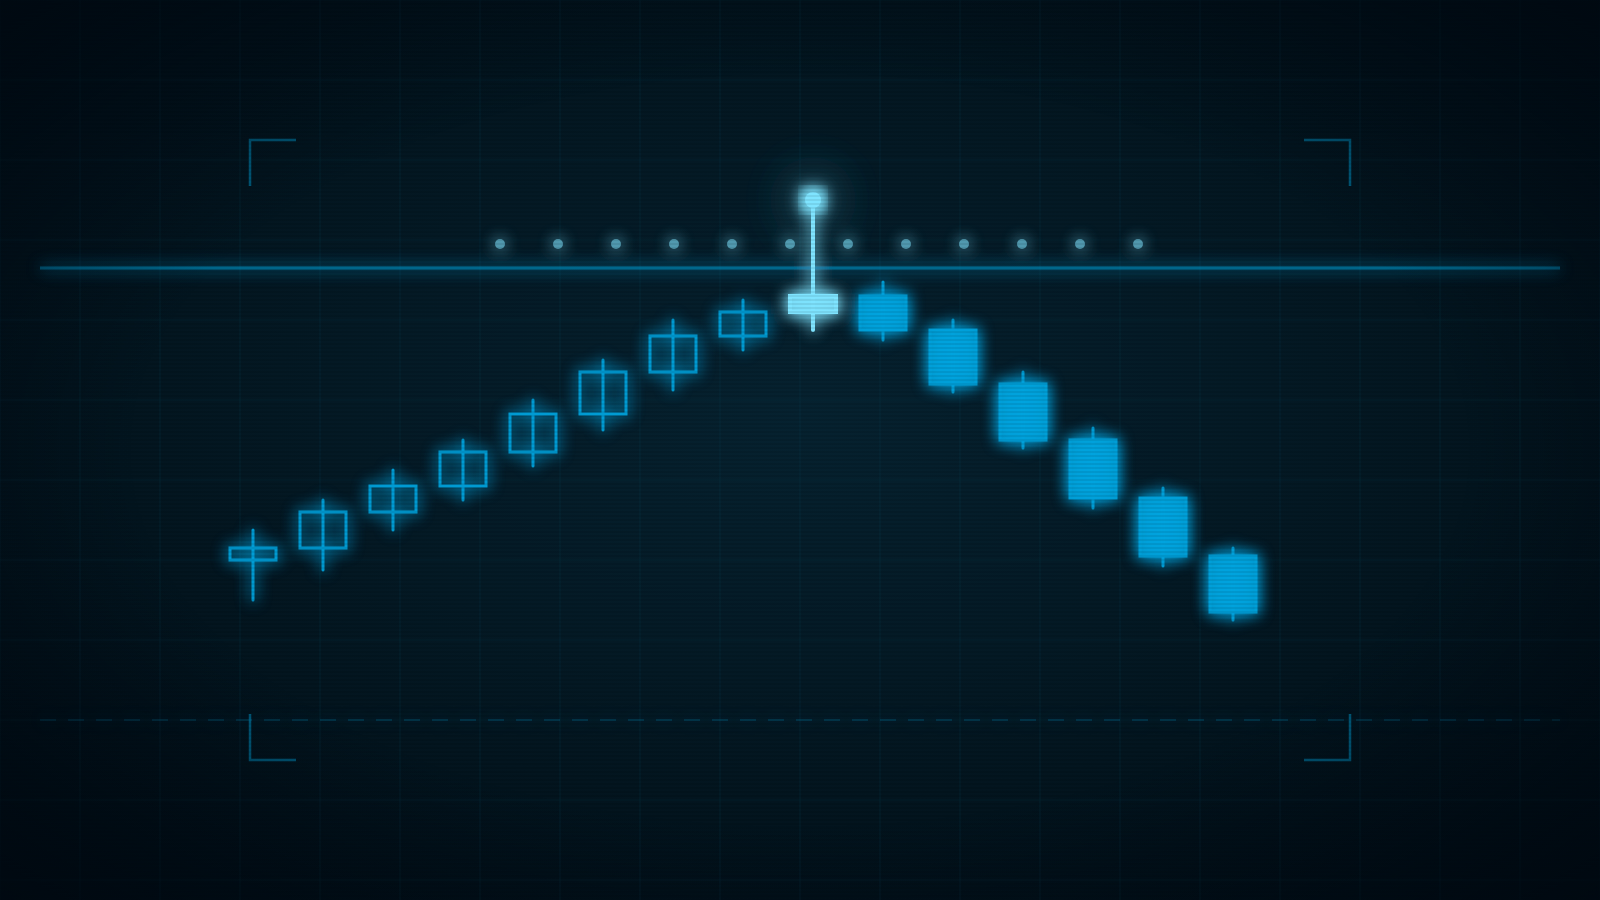
Most traders draw levels. Fewer can say what a level is for.
A horizontal line on a chart is not a support or resistance zone in any mechanical sense. It is a place where a known population of orders is sitting. That’s the whole thing. Once you frame it that way, “will this level hold” becomes the wrong question, and “what is resting there, and does the market need it” becomes the right one.
This is the first idea worth getting right, because every other concept in the SweepLogic Arsenal— fair value gaps, order blocks, displacement, killzones — is downstream of it. They are all descriptions of how price travels. Liquidity is the description of why.
What actually sits at a level
Take the prior day’s high on NQ. Three distinct order populations cluster just above it:
- Protective stops from traders who are short from below and placed risk above the obvious swing.
- Breakout entries from traders who buy strength above the prior day’s range.
- Resting limit sells from participants using the level as a fade.
The first two are buy orders. Stops on a short position are buy-stops. Breakout entries above a level are buy-stops. That means the area immediately above an obvious high is dense with buy-side liquidity — a pool of orders that will execute automatically if price reaches them.
Large participants need that. Size cannot be filled into thin books. If you need to sell a meaningful position, you need buyers, and the most reliable concentration of buyers is directly above a high everyone can see.
This is why price so often trades through an obvious level and then reverses. The move through the level was not a failed breakout. It was the fill.
Buy-side liquidity sits above highs. Sell-side liquidity sits below lows.
The naming is counterintuitive at first — the pool above a high is called buy-side because the orders resting there are buy orders, not because you should be buying. Get this straight early; it recurs constantly.
Which levels carry weight
Not every line is equal. Liquidity concentration is a function of how many participants are looking at the same reference. In rough order of density on index futures:
- Prior day high and low. The single most-watched intraday reference. Nearly every retail platform draws them by default; nearly every desk tracks them.
- Prior week high and low. Lower frequency, higher weight. These tend to act as multi-day draws rather than intraday targets.
- Equal highs and equal lows. Two or more swing points at effectively the same price. Each additional touch stacks more stops at the same level. A double top is not a reversal pattern — it is a liquidity magnet with two layers of stops sitting above it.
- Session opens. Midnight open, 08:30, 09:30, and the weekly opens (Sunday 18:00 ETH, Monday 09:30 RTH). These matter less as stop pools and more as equilibrium references — the market’s own definition of premium and discount for the session.
- Prior session highs and lows. Asia range, London range. Especially relevant during the New York session, where the day’s first move is frequently a run on one side of the overnight range.
Draw on liquidity
The practical version of this idea is what ICT calls the draw on liquidity — the pool price is currently working toward.
At any given moment there is liquidity above and liquidity below. Both exist. The analytical work is deciding which one the market is currently drawn to, and that decision comes from context: which side was already taken, where the higher-timeframe imbalance sits, whether structure has shifted, what the daily candle is doing relative to its open.
Two rules make this tractable:
- A pool that has already been swept is no longer a draw. Once the stops above an equal-highs cluster have been run, the fuel is gone. Price rarely returns to take the same liquidity twice in the same session. Track what has been taken and what hasn’t — that alone reorders your target list.
- The next draw is usually the nearest untouched pool in the direction of the higher-timeframe bias. Not the furthest. Not the most dramatic. The nearest one that hasn’t been consumed.
A level that has already been swept isn’t support. It’s a used ticket.
Why this changes your targets
Most target-setting is arbitrary — a fixed point count, a round number, a Fibonacci extension chosen because it looked reasonable. Liquidity-based targeting replaces that with a question you can actually answer: where is the next pool of resting orders, and is it untouched?
That framing does something structural to a trading plan. It gives every target a reason that exists on the chart rather than in your preferences. And it makes invalidation legible — if price sweeps the pool you were targeting and immediately reverses, you know what happened and why the move ended there.
It also explains the frustration of trading obvious levels naively. Buying a bounce at the prior day low, without accounting for the sell-side liquidity resting beneath it, means entering directly in front of the very orders the market is coming to collect.
Building the habit
Start each session by marking the untouched pools. Not every line — the ones that carry weight. Prior day high and low. Any equal highs or lows from the last several sessions that haven’t been run. The overnight range extremes. Session opens for reference.
Then, before the open, answer one question in writing: which pool is the more likely draw today, and what would tell me I’m wrong?
That’s the entire exercise. Everything else — entry model, confirmation, sizing — is downstream of getting that one call framed properly.
Where SweepLogic fits
SweepLogic Key Levels plots the reference set automatically on NQ and ES: prior day and prior week high/low, session opens including both weekly opens, the overnight and Asia ranges, and opening range levels. Each level carries a broken/unbroken state using body close-through — a wick past a level does not mark it taken, which matches how the concept is actually taught.
The point isn’t that the lines get drawn for you. It’s that the state is tracked for you, so the “what’s already been swept” question is answered on the chart instead of in your head at 09:31.
Pairs naturally with FVG Pro+ for the imbalance that forms on the reaction, and Order Blocks for the origin of the leg that runs the pool.
Lifetime license · Free updates · Discord community
Trade safe, trade well. Talk soon.
SweepLogic
Educational content only. Nothing here is financial advice or a recommendation to trade. Futures trading involves substantial risk of loss and is not suitable for every investor. Past market behavior does not indicate future results. SweepLogic products are analytical tools; they do not predict market direction and do not produce trading results on their own.
- FROM THE SUITE