

Fair Value Gap Indicator for NinjaTrader 8: What It Should Mark
No indicator is right for everyone — it depends on what you trade and what you already know how to read. But the ones worth keeping share a short list of properties, and the ones you uninstall tend to fail in the same four places. Here’s the checklist, category by category.

By SWEEPLOGIC
- October 26, 2026
- 5 Min Read
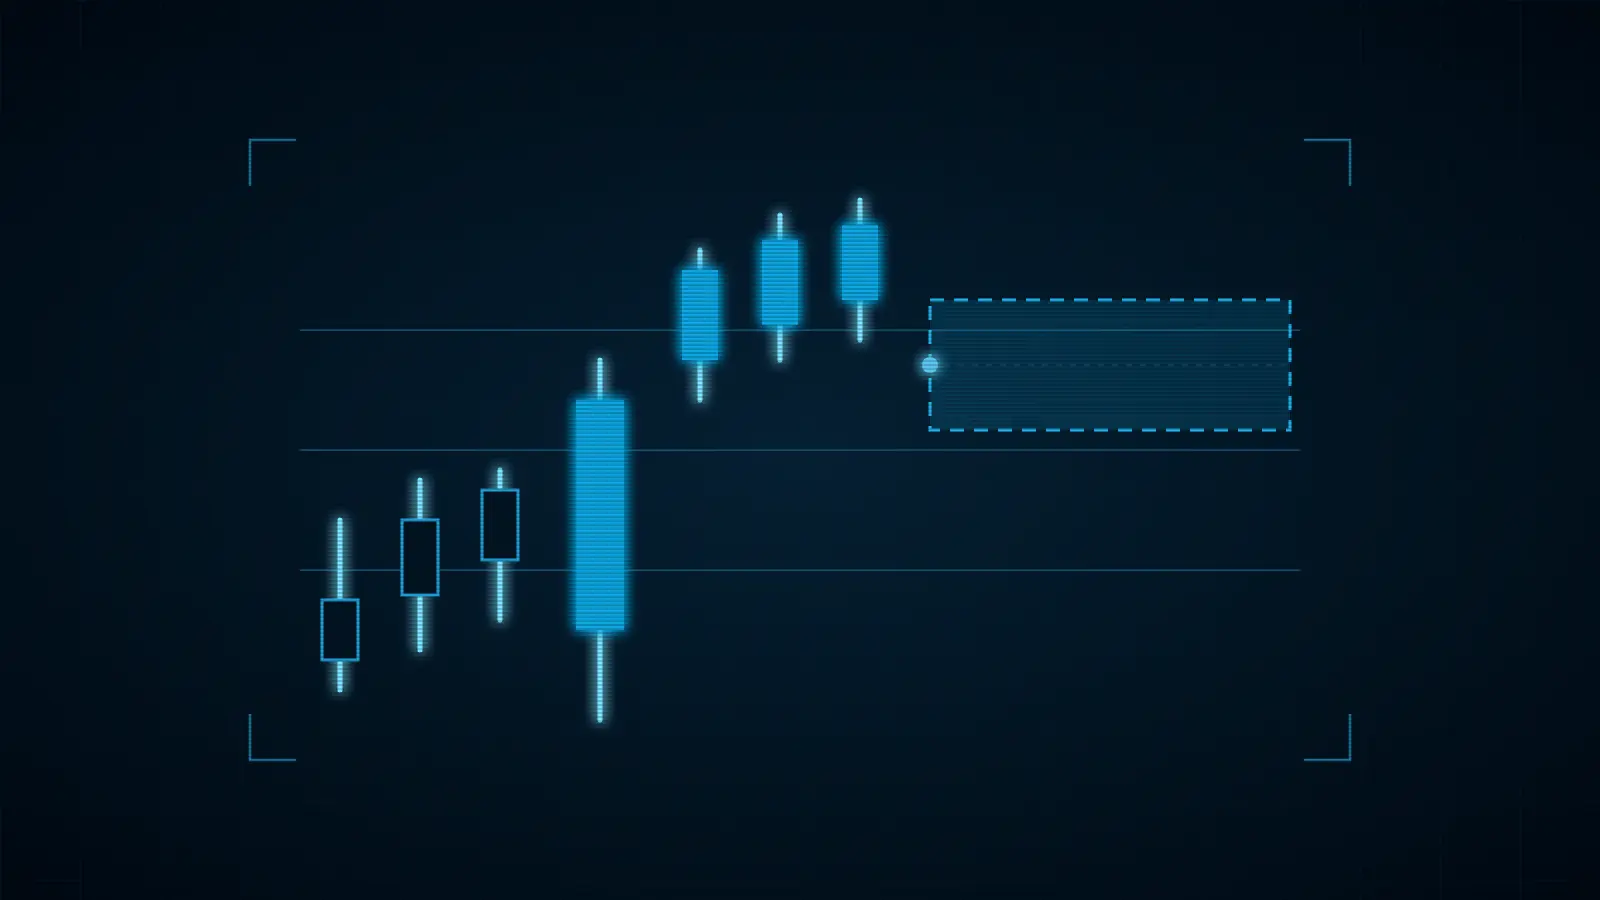
A fair value gap indicator for NinjaTrader 8 should do four things: mark every three-candle imbalance automatically, show how much of it price has filled, flag the gap when it fails, and let you see gaps from higher timeframes.
Anyone can draw a rectangle between two candles. The work is in keeping track of dozens of them as the session develops, which ones are still open, and which ones price has already closed through. That is what an indicator is for.
This guide covers what a fair value gap is in mechanical terms, what a good indicator marks, and how to judge one before you trust it on a live chart.
What a fair value gap actually is
A fair value gap (FVG) is a three-candle pattern where the middle candle moves fast enough that the first and third candles do not overlap. The space between them is the gap.
- Bullish FVG. The low of candle 3 is above the high of candle 1. The gap runs from the high of candle 1 up to the low of candle 3.
- Bearish FVG. The high of candle 3 is below the low of candle 1. The gap runs from the low of candle 1 down to the high of candle 3.
- Consequent encroachment (CE). The 50% midpoint of the gap. Many traders treat the CE as the line that decides whether a gap is holding.
The idea is that price moved through that range quickly and without much two-way trade, so it often comes back to test it. That is a tendency to study, not a guarantee.
What a good indicator should mark
- Detect both directions automatically. Bullish and bearish gaps, drawn the moment the third candle closes, with no manual rectangles.
- Track the lifecycle. A gap is not just there or gone. It is untouched, then touched at the CE, then partially filled, then fully mitigated. The box should change as that happens.
- Shrink or retire filled zones. A zone that price has already traded through should not keep cluttering the chart.
- Flag the inversion. When price closes through a gap instead of respecting it, the gap has failed, and many ICT traders watch that level as an inverse fair value gap (IFVG).
- Show higher timeframe gaps. A 15-minute gap on a 1-minute chart is context you cannot see by eye on the smaller chart. The indicator should draw it for you.
- Let you filter size. On a fast futures chart, tiny gaps appear all the time. A minimum size setting keeps the chart readable.
How to test one before you trust it
Run these checks on Sim, with the indicator on a chart you know well.
- Compare against your own markup. Mark five gaps by hand using the three-candle rule, then see whether the indicator agrees. Disagreements usually come from different gap-size filters.
- Reload the chart. Gaps should look the same after a reload. If past zones move, something is repainting.
- Check a close through a gap. Watch what it does when a candle closes beyond the far edge. It should change state, not just sit there.
- Switch timeframes. Load a 1-minute chart and a 5-minute chart side by side and confirm the higher timeframe zones line up.
- Watch the Output window. Errors there on load mean a conflict, often a leftover file. See the import error guide if you hit one.
If you have not imported an indicator before, follow the install guide first: How to Install Indicators in NinjaTrader 8.
Not every gap deserves a box
The most common mistake is treating every gap as a trade. On a one-minute futures chart there can be dozens in a session, and most are noise. Three filters help:
- Time. Gaps that form inside your killzone matter more than gaps at 12:15. See Time Is a Filter: Killzones and Macro Windows.
- Context. A gap that forms right after a sweep of obvious liquidity says more than one in the middle of a range. See Draw on Liquidity.
- Sequence. The first gap of the session carries extra weight for many traders. That is the whole premise of the First Presented FVG.
Quick answers
Does NinjaTrader 8 have a built-in fair value gap indicator?
I could not confirm one in the default indicator list. Open the indicator window on a chart and search for it on your own install.
What is the difference between an FVG and an IFVG?
An FVG is the original three-candle imbalance. An IFVG is that same zone after price closes through it, so it is read in the opposite direction.
What is consequent encroachment?
The 50% midpoint of a fair value gap, used as a reference for whether the gap is being respected.
Will an FVG indicator tell me when to enter?
No. It maps the gaps. Entry, stop and size are still your decisions, and they should come from your plan.
Where FVG Pro+ fits
FVG Pro+ is SweepLogic’s native NinjaTrader 8 indicator for this job. It detects bullish and bearish fair value gaps across your chart and higher timeframes and tracks each one through consequent encroachment, partial fill and complete mitigation. When a gap fails and price closes through, it flags the inversion so you can see the IFVG. Multi-timeframe support is built in.
If you only want to study one gap per session, the First Presented FVG is free. For the full range, see the SweepLogic tools. The reasoning behind the first-gap idea is in The First Presented FVG.
Questions? Ask in the SweepLogic Discord or contact support.
Educational and technical content only. Nothing here is financial advice. SweepLogic is not affiliated with NinjaTrader; NinjaTrader and NinjaScript are trademarks of their respective owner. Futures trading involves substantial risk of loss and is not suitable for every investor.
- FROM THE SUITE
FVG Pro+
Detects FVG/IFVGs the moment they form. Multi-time-frame support.